
Introduction
Splunk is a platform to process machine data from various sources such as weblogs, syslogs, log4j logs and can also work with JSON and CSV file formats thus any application that produces JSON or CSV output can be seen as a source for Splunk. As the volume and variety of machine data are increasing, Splunk is becoming a more and more interesting player in big data world, too.
Splunk can be considered as a search engine for IT data. Splunk collects data from multiple sources, indexes them and the users can search them using Splunk proprietary language called SPL (Search Processing Language). The search results can then be used to create reports and dashboards to visualize the data.
Splunk Architecture
Under the hood Splunk architecture has the following key components:
– forwarders are used to forward data to Splunk receiver instances. Receiver instances are normally indexers.
– indexers that are splunk instances to index data. Indexes are stored in files. There are two types of files; raw datafiles which store the data in compressed format and index files that contain metadata for search queries. During indexing, Splunk extracts default fields and identifies events based on timestamps or creates them if there is no timestamp found.
– search head and search peers. In a distributed environment search head manages the search requests, directs them to search peers and then merges result back to the users.
– Splunk Web is a graphical user interface based on Python application server.

Splunk Storm
Splunk Storm is a cloud service version of Splunk. Splunk Storm runs in the Amazon cloud and uses of both Elastic Block Storage (EBS) and the Simple Storage Service (S3).
The price plan is based on monthly fee, it depends on the volume of the data that you want to store. As of writing this article, there is a free tier with 1 GB storage, while for example 100 GB storage volume costs 400 USD and the maximum 1 TB storage volume costs 3,000 USD per month.
To get started, we need to sign up and crate a project.

Then we can define the data inputs. There are four options: upload a file, use forwarders, use the API (it is in beta yet) or use network data sent directly from the servers.
As a first test, we will use data files uploaded from a local directory. We used a sample apache web access.log and a syslog available from http://www.monitorware.com/en/logsamples/
It takes a some time to index the files and then they become available for search queries.

We can run a search query to identify all HTTP client side error codes:
"source="access_log.txt" status>="400" AND status <="500"

If we want to identify all the access log entries with HTTP POST method, we can run the following search query:
source="access_log.txt" method="POST"
In a similar way, if we want to find all the messages from the uploaded syslog file that were generated by the kernel process then we can run the following query:
source="syslog-messages.txt" process="kernel"

Splunk forwarder and Twitter API
As a next example, we want to test output generated by our program using Twitter API. The program will generate JSON format in a file using Python based Twitter API. The directory is monitored by a Splunk forwarder and once the file is created in the predefined directory, the forwarder will send it to Splunk Storm.
First we need to create an application in Twitter via https://dev/twitter.com portal. The application will have its customer_key, customer_secret, access_token_key and access_token_secret that is going to be required by the Twitter API.

The Twitter API that we are going to use for the Python application is downloadable from Github, https://github.com/bear/python-twitter.git .
This API depends oauth2, simplejson and httplib2 so we need to installed them first. Then we can get the code from Github and build and install the package.
$ git clone https://github.com/bear/python-twitter.git

# Build and Install:
$ python setup.py build
$ python setup.py install
The Twitter application code – twtr.py – is as follows:
# twtr.py
import sys
import twitter

if len(sys.argv) < 3:
    print "Usage: " + sys.argv[0] + " keyword count"
    sys.exit(1)

keyword = sys.argv[1]
count = sys.argv[2]
# Twitter API 1.1. Count - up to a maximum of 100
# https://dev.twitter.com/docs/api/1.1/get/search/tweets
if int(count) > 100:
    count = 100

api = twitter.Api(consumer_key="CONSUMER_KEY", consumer_secret="CONSUMER_SECRET", access_token_key="ACCESS_TOKEN_KEY", access_token_secret="4PXvz7QIiwtwhFrFXFEkc9wY7iBOdgusD8ZQLvUhabM" )

search_result = api.GetSearch(term=keyword, count=count)

for s in search_result:
    print s.AsJsonString()
The Python program can be run as follows:
$ python twtr.py "big data" 100
Installing Splunk forwarder
Then we need to install Splunk forwarder, see http://www.splunk.com/download/universalforwarder . We also need to download the Splunk credentials that will allow the forwarder to send data to our project. Once the forwarder and the ceredentials are installed we can login and add a directory (twitter_status) for our forwarder to be monitored. We defined the sourcetype as json_notimestamp.
# Download splunk forwarder
$ wget -O splunkforwarder-5.0.3-163460-Linux-x86_64.tgz 'http://www.splunk.com/page/download_track?file=5.0.3/universalforwarder/linux/splunkforwarder-5.0.3-163460-Linux-x86_64.tgz&ac=&wget=true&name=wget&typed=releases&elq=8ccba442-db76-4fc8-b36b-36252bb61257'

# Install and start splunk forwarder
$ tar xvzf splunkforwarder-5.0.3-163460-Linux-x86_64.tgz
$ export SPLUNK_HOME=/home/ec2-user/splunkforwarder
$ $SPLUNK_HOME/bin/splunk start
# Install project credentials
$ $SPLUNK_HOME/bin/splunk install app ./stormforwarder_2628fbc8d76811e2b09622000a1cdcf0.spl -auth admin:changeme
App '/home/ec2-user/stormforwarder_2628fbc8d76811e2b09622000a1cdcf0.spl' installed

# Login
$SPLUNK_HOME/bin/splunk login -auth admin:changeme

#' Add monitor (directory or file)
 $SPLUNK_HOME/bin/splunk add monitor /home/ec2-user/splunk_blog/twitter_status -sourcetype json_no_timestamp
Added monitor of '/home/ec2-user/splunk_blog/twitter_status'.
Now we are ready to run the Python code using Twitter API:
$ python twtr.py "big data" 100 | tee twitter_status/twitter_status.txt
The program creates a twitter_status.txt file under twitter_status directory which is monitored by Splunk forwarder. The forwarder sends the output file to Splunk Storm. After some time it will appears under the inputs sections as authenticated forwarder. The file will be shown as a source together with the previously uploaded apache access log and syslog.


If we want to search for users with location London, the search query looks like this:
source="/home/ec2-user/splunk_blog/twitter_status/twitter_status.txt" user.location="London, UK"
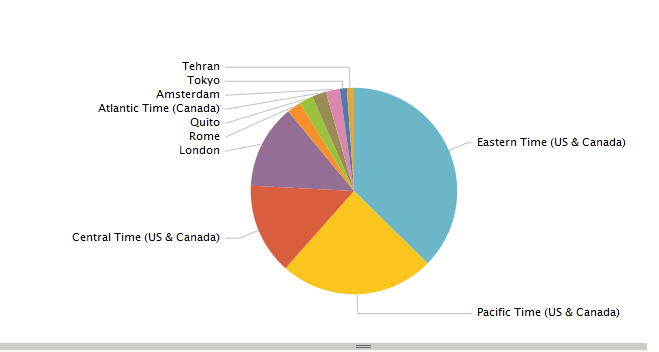
We can also define a search query to show the top 10 timezones from the Twitter result and from the search result it is easy to create a Report with just a few clicks on the web user interface. The report allows to chose multiple visualization options like column, area or pie chart types, etc.
source="/home/ec2-user/splunk_blog/twitter_status/twitter_status.txt" | top limit=10 user.time_zone

Conclusion
As mentioned in the beginning of this article, the variety and the volume generated by machines are increasing dramatically; sensor data, application logs, web access logs, syslogs, database and filesystem audit logs are just a few examples of the potential data sources that require attention but can pose difficulties to process and analyse them in a timely manner. Splunk is a great tool to deal with the ever increasing data volume and with Splunk Storm users can start analysing their data in the cloud without hassle.
